Paths –
So, earlier this week I was learning how to use the Charts framework and started customizing the symbols. There are a bunch of basic ones (see the BasicChartSymbolShape struct). You can also pass in a custom view to use as a symbol. This is cool, but I thought it might be cool to build my own custom shape.
To create a custom symbol shape (like BasicChartSymbolShape) you must conform to the ChartSymbolShape protocol (which conforms to the Shape protocol). So how do we do this? The easiest way to find out is create a struct and declare it’s conformance and see what the compiler says:
stuck CustomChartSymbolShape: ChartSymbolShape {

}
Of course, the compiler informs us that we neither conform to ChartSymbolShape nor Shape, but it offers to help us. Lets select fix:
struct AppChartSymbolShape: ChartSymbolShape {
    var perceptualUnitRect: CGRect

    func path(in rect: CGRect) -> Path {

    }
}
Perfect. Now we’re cooking. First things first, let’s provide a path. Path is a SwiftUI struct used to create all sorts of shapes (like Circle or Rectangle). I’ve got an app called StemFox whose logo is a fox face sorta shaped like a book. After some trial and error I came up with this:
// 1. Declare conformance to shape
struct StemFox: Shape {
    // 2. Create the path
    func path(in rect: CGRect) -> Path {

        // 3. helper variables
        let maxX = rect.maxX
        let midX = rect.midX
        let maxY = rect.maxY
        let minX = rect.minX
        let minY = rect.minY

        // 4. Adjust for frame location differences
        let yDifference = maxY - minY
        let yLower = 2 * yDifference / 3 + minY
        let yUpper = yDifference / 3 + minY

        // 5. Construct the path
        var path = Path()

        path.move(to: CGPoint(x: minX, y: minY))
        path.addLine(to: CGPoint(x: midX, y: yUpper))
        path.addLine(to: CGPoint(x: maxX, y: minY))
        path.addLine(to: CGPoint(x: maxX, y: yLower))
        path.addLine(to: CGPoint(x: midX, y: maxY))
        path.addLine(to: CGPoint(x: minX, y: yLower))
        path.addLine(to: CGPoint(x: minX, y: minY))

        return path
    }
}
What’s going on here:
- We create a shape called StemFox and conform to the Shape protocol.
- To conform to Shape, we must provide the path(in rect: CGRect) method
- We create some helper variables, just for reference.
- We must scale our positions appropriately. If we don’t do this step, and instead only used something like maxY / minY here, the shape would only work as a stand alone view whose origin is always at (0,0). The rect passed in when used for data points in charts are in the space of the chart as a whole, with the origin bouncing all over the place. Without this step, the rendering gets very odd indeed.
- With all the math done, we just connect the dots to draw our shape.
We can use StemFox in SwiftUI like any other shape:
StemFox()
    .frame(width: 50, height: 50)
And it produces a fair rendition of the original logo:

As cool as this looks, most Chart symbols are outlines, so let’s make this an outline. We can do this by returning the stroked path version of our path: return path.strokedPath(StrokeStyle()). This results in a very nice outline:

Awesome! Now lets use this shape in our AppChartSymbolShape:
struct AppChartSymbolShape: ChartSymbolShape {

    var perceptualUnitRect: CGRect

    func path(in rect: CGRect) -> Path {
        StemFox()
            .path(in: rect)
    }
}
Now we just need to create an extension on ChartSymbolShape to enable easy use:
extension ChartSymbolShape where Self == AppChartSymbolShape {
    /// StemFox symbol.
    static var stemFox: AppChartSymbolShape {
        AppChartSymbolShape(perceptualUnitRect: .unit)
    }
}

// And for ease of use
extension CGRect {
    static var unit: CGRect {
        CGRect(origin: .zero, size: .unit)
    }
}

extension CGSize {
    static var unit: CGSize {
        CGSize(width: 1, height: 1)
    }
}
Finally we are ready to use it in a chart:
import Charts

struct Info: Identifiable {
    let id = UUID()
    let value: Double
    let date: Int
}

let data = [
    Info(value: 10, date: 0),
    Info(value: 1, date: 1),
    Info(value: 4, date: 2),
    Info(value: -3, date: 3),
    Info(value: 4, date: 4),
]

struct ContentView: View {
    var body: some View {
        VStack {

            Chart(data) { data in
                LineMark(
                    x: .value("Date", data.date),
                    y: .value("Frequency", data.value)
                )
                .symbol(.stemFox)
            }
            .frame(height: 250)
            .chartYAxisLabel(position: .automatic, alignment: .trailing, content: {
                Text("Frequency")
            })

            StemFox()
                .frame(width: 50, height: 50)

            Text("Hello, world!")
        }
        .padding()
    }
}
This code yields the following chart and shape:
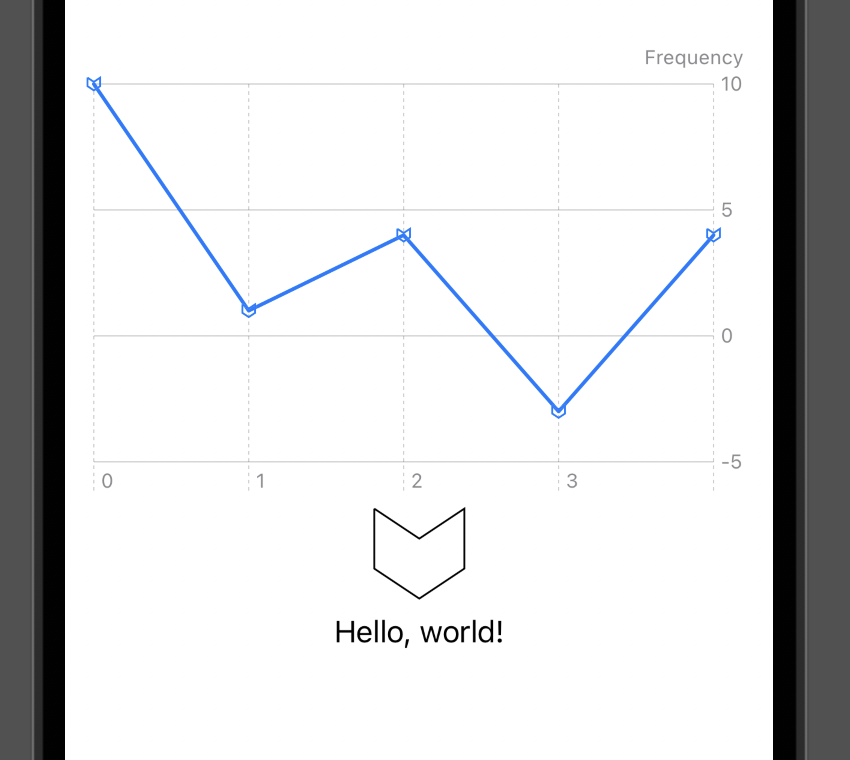
Not difficult and kinda fun!
Further Reading:
https://www.hackingwithswift.com/books/ios-swiftui/creating-custom-paths-with-swiftui
https://developer.apple.com/documentation/swiftui/shape
https://developer.apple.com/documentation/charts/chartsymbolshape